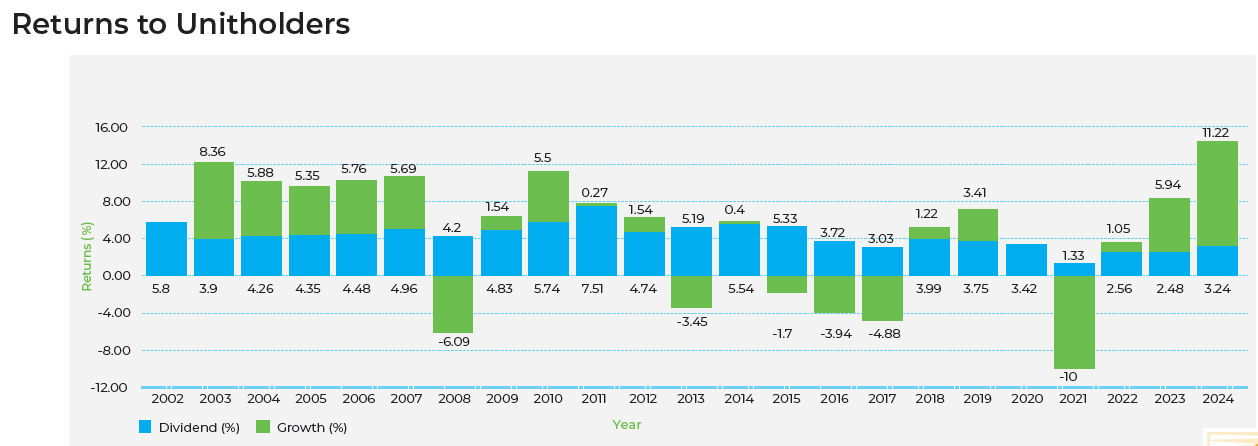
For the purposes of better informing investors about the performance of the FHUT, the Directors consider it appropriate to highlight the performance of FHUT in this Prospectus
Tabulated below is FHUT’s growth from inception to 30th June 2024.
| Figures as at 30th June | Funds under Management ($m) | Total Dividend Distribution ($) | Total Dividend Distribution per Unit ($) | No. of Unit Holders | Dividend Return (%) | Growth Return (%) | Total Return (%) |
|---|---|---|---|---|---|---|---|
| 2010 | 30.93 | 1,693,851 | 0.0372 | 3658 | 5.74 | 5.50 | 11.24 |
| 2011 | 33.92 | 2,553,199 | 0.0517 | 3901 | 7.51 | 0.27 | 7.78 |
| 2012 | 38.90 | 1,776,493 | 0.0329 | 4,010 | 4.74 | 1.54 | 6.28 |
| 2013 | 45.77 | 2,420,749 | 0.0386 | 4,136 | 5.19 | -3.45 | 1.74 |
| 2014 | 59.96 | 3,174,668 | 0.0416 | 4,469 | 5.54 | 0.4 | 5.94 |
| 2015 | 79.09 | 4,121,669 | 0.0422 | 6,449 | 5.33 | -1.70 | 3.63 |
| 2016 | 90.09 | 3,423,192 | 0.0302 | 8,772 | 3.72 | -3.94 | -0.22 |
| 2017 | 96.22 | 3,011,632 | 0.0248 | 11,469 | 3.03 | -4.88 | -1.85 |
| 2018 | 110.79 | 4,240,563 | 0.0327 | 14,043 | 3.99 | 1.22 | 5.21 |
| 2019 | 125.88 | 4,599,272 | 0.03654 | 16,214 | 3.75 | 3.40 | 7.16 |
| 2020 | 127.44 | 4,605,322 | 0.03614 | 18,849 | 3.42 | 0 | 3.42 |
| 2021 | 130.02 | 1,910,943 | 0.01334 | 21,994 | 1.40 | -10 | -8.60 |
| 2022 | 140.34 | 3,582,139 | 0.01134 | 24,744 | 2.53 | 1.05 | 3.58 |
| 2023 | 154.82 | 4,008,309 | 0.0250 | 29,428 | 2.48 | 5.94 | 8.42 |
| 2024 | 181.19 | 6,094,373 | 0.0350 | 33,420 | 3.24 | 11.22 | 14.47 |


Calculation of FHUT Returns
FHUT returns are calculated on quarterly basis as per the formula below provided by the Reserve Bank of Fiji.
The distribution return is calculated by dividing the distribution received during the financial year with the entry price at the start of the period.

The growth return is the exit price at the end of the period less the entry price of the start of the period which is then dividend by the entry price at the start of the period.

The total return is the addition of the distribution return and growth return.
Total Return = Distribution Return + Growth Return
Unit holders are to note that distributions are assumed to be paid out and not reinvested and that no allowance has been made for the effects of tax and inflation. The entry and exit prices used in the calculations are net of fees as to reflect the performance of the fund.
Information on Performance
Unit holders can obtain an Annual Report from the FHUT Office’s to inform them on FHUT’s annual performance. Annual reports can also be retrieved from our website on www.fhut.com.fj. For more information on the current performance of the FHUT, please contact our unit trust representatives.
